Interpolation with splines
Posted February 27, 2013 at 02:43 PM | categories: interpolation | tags:
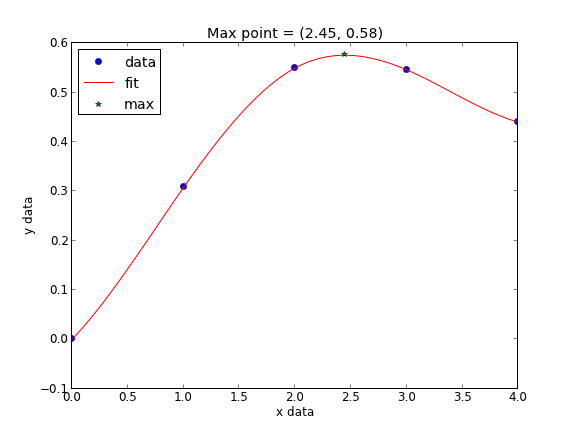
When you do not know the functional form of data to fit an equation, you can still fit/interpolate with splines.
# use splines to fit and interpolate data
from scipy.interpolate import interp1d
from scipy.optimize import fmin
import numpy as np
import matplotlib.pyplot as plt

x = np.array([ 0,      1,      2,      3,      4    ])
y = np.array([ 0.,     0.308,  0.55,   0.546,  0.44 ])

# create the interpolating function
f = interp1d(x, y, kind='cubic', bounds_error=False)

# to find the maximum, we minimize the negative of the function. We
# cannot just multiply f by -1, so we create a new function here.
f2 = interp1d(x, -y, kind='cubic')
xmax = fmin(f2, 2.5)

xfit = np.linspace(0,4)

plt.plot(x,y,'bo')
plt.plot(xfit, f(xfit),'r-')
plt.plot(xmax, f(xmax),'g*')
plt.legend(['data','fit','max'], loc='best', numpoints=1)
plt.xlabel('x data')
plt.ylabel('y data')
plt.title('Max point = ({0:1.2f}, {1:1.2f})'.format(float(xmax),
                                                    float(f(xmax))))
plt.savefig('images/splinefit.png')
Optimization terminated successfully.
         Current function value: -0.575712
         Iterations: 12
         Function evaluations: 24
There are other good examples at http://docs.scipy.org/doc/scipy/reference/tutorial/interpolate.html
Copyright (C) 2013 by John Kitchin. See the License for information about copying.